There are numerous examples in nature and industry where it is important to have a thorough knowledge and understanding of the chemical composition of a material at the nano level. However, typical spectroscopic techniques that have the chemical sensitivity to identify molecules at surfaces, have a limited spatial resolution and cannot resolve features in the nanometer (nm) scale, which is important when developing new advanced materials and explaining phenomena in nature.
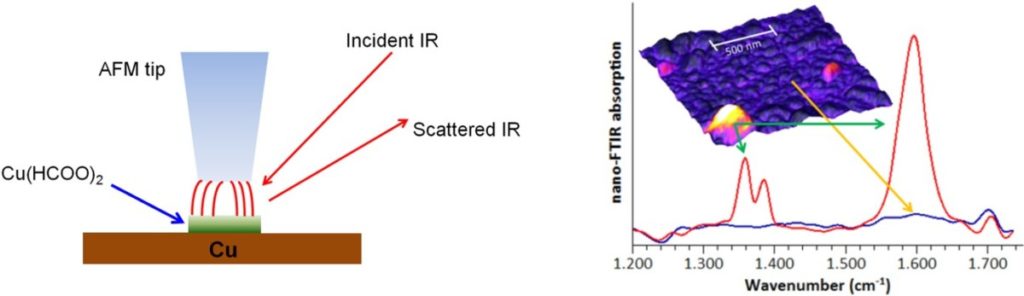
For instance, conventional infrared (IR) microscopy has a spatial resolution that ranges from a few to tens of micrometers (mm), while the spatial resolution in confocal Raman microscopy is several hundreds of nm. Other high-resolution techniques such as atomic force microscopy (AFM) that can yield topography and mechanical maps on the nanometer scale, lack chemical sensitivity and cannot provide information about the nature of molecules. Thus, to make further progress there is a clear need to combine the chemical information available from spectroscopy and the spatial resolution of AFM. Quite recently this has become possible with nano infrared (FTIR) microscopy, which is a combination of IR spectroscopy and AFM, that provides IR spectra and thus chemical information with a spatial resolution of less than 20 nm.1
The technique can be used to study a vast number of solid surfaces at the nanoscale, and is being employed in our lab in the following projects:
- The formation of corrosion products and the breakdown of protective films in atmospheric corrosion processes.2,3
- The structure and composition of plant-based materials.
- The molecular structure of cell membranes.4
- The aggregation of the amyloid-β peptide and its interaction with other molecules (drug candidates or links between Alzheimer’s disease and other neurodegenerative diseases).
References
1) Nano Letters 12, 3973. DOI:10.1021/nl301159v2) Corrosion Science, 108, 60. DOI: 10.1016/j.corsci.2016.02.037
3) Journal of the Electrochemical Society, 2019, 166, C3456. DOI: 10.1149/2.0531911jes
4) ACS Omega, 2018, 3, 4141. DOI:10.1021/acsomega.7b01931
Technique Guides